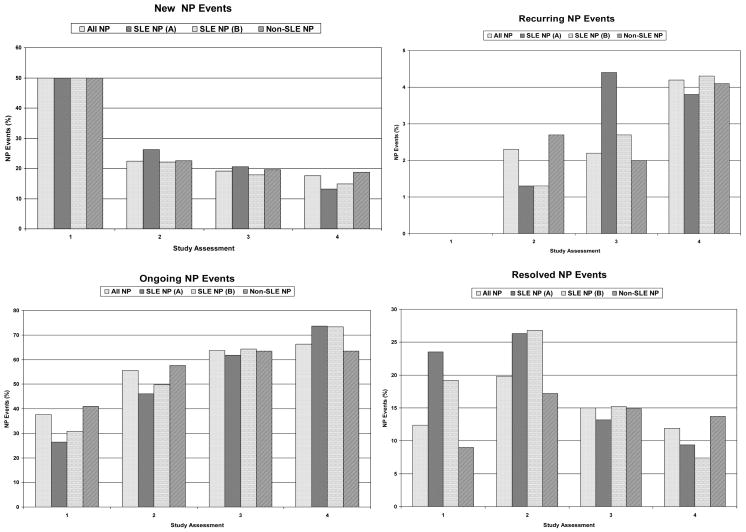
Figure 2.
The frequency of NP events at enrollment and at subsequent study assessments characterized as new, recurring or ongoing from a previous assessment. At each assessment the status of the NP events into resolved or unresolved is shown. Summary data is shown for NP events regardless of attribution (all NP events), NP events attributed to SLE as per attribution model A (SLE NP (A)), NP events attributed to SLE as per attribution model B (SLE NP (B)) and NP events attributed to non-SLE causes (non-SLE NP).

