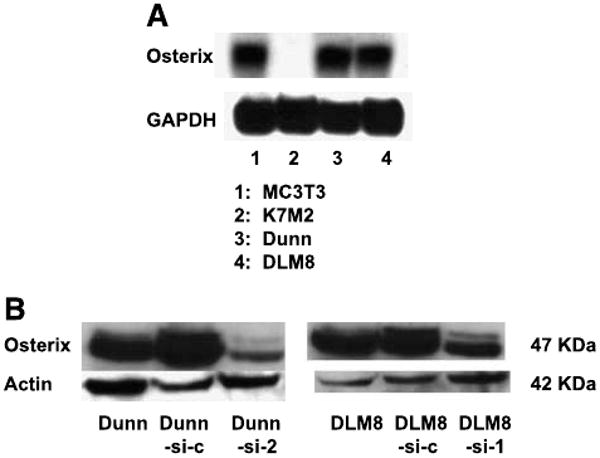
FIGURE 2.

Suppression of Osx by specific siRNA. A. Total RNA was extracted from Dunn and DLM8 cells. Osx expression was quantified by Northern blot. Glyceraldehyde-3-phosphate dehydrogenase (GAPDH) was used as loading control. MC3T3 and K7M2 cells were used as positive and negative control cells, respectively. B. Total protein was extracted from Dunn and DLM8 parental cells, from Dunn-si-c and DLM8-si-c control vector – transfected cells, and from Dunn-si-2 and DLM8-si-1 Osx siRNA – transfected cells. Osx protein was quantified by Western blot.
