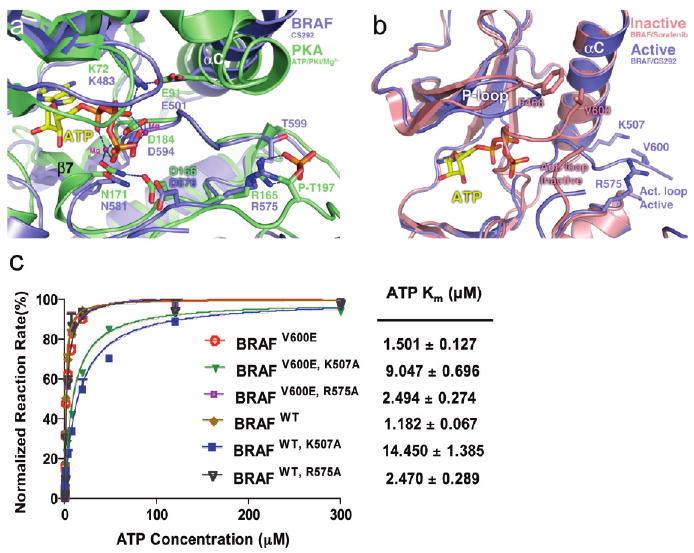
Figure 4.

BRAF kinase in an active conformation. (a) Superposition of the BRAF–CS292 complex protein fragment with the PKA–ATP complex (PDBentry 1ATP). The BRAF kinase is colored blue and PKA green. Essential catalytic residues are shown in stick figure representation with color coding corresponding to each kinase. Magnesium ions are shown as magenta spheres, and hydrogen bonding interactions are shown as blue dashes. Part of the activation loop is truncated for better viewing of the PKA phospho-Thr197. (b) Superposition of the BRAF–CS292 complex with BRAF in an active conformation with the BRAF–Sorafenib complex in an inactive conformation. The BRAF–CS292 complex is colored blue and the BRAF–Sorafenib complex red. (c) ATP Km measurements of BRAFV600E and BRAFWT kinases and effect of K507A and R575A mutations on Km,ATP. The reaction rate is normalized against the Vmax of each kinase construct, and Km values are extrapolated from a sigmoidal curve fitting model and listed in units of micromolar. All compounds were used as racemic mixtures.
