Figure 5.

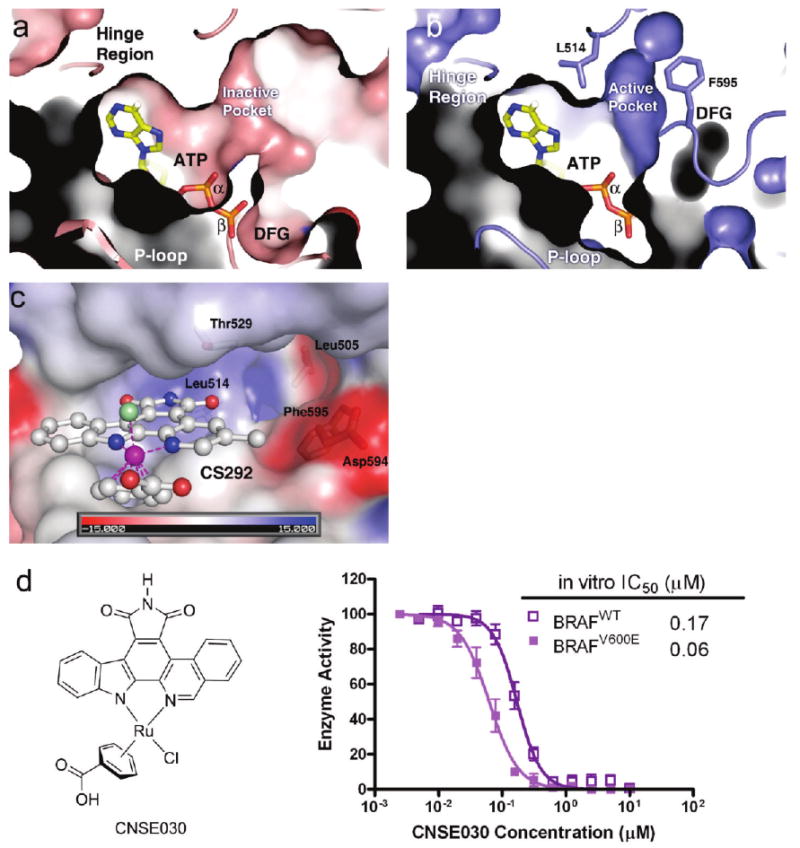
Details of the ATP binding site of the active BRAF conformation. (a) Superposition of ATP in the ATP binding site of BRAF in an inactive conformation (BRAF–Sorafenib). Note that the β- and γ-phosphates of ATP clash with the ATP binding pocket due to the inward activation loop. (b) Superposition of ATP in the ATP binding site of BRAF in an active conformation (BRAF–CS292). Phe595 and Leu514 are shown in stick model to indicate the active pocket. Note the different positions of the DFG motif indicating dramatic differences in activation loop conformation. (c) Electrostatic potential maps of the BRAF–CS292 complex structure highlighting the residues forming the “BRAF-specific pocket”. (d) Chemical structure of compound CNSE030 and its inhibition against BRAFWT and BRAFV600E. The data represent an average of triplicate measurements.
