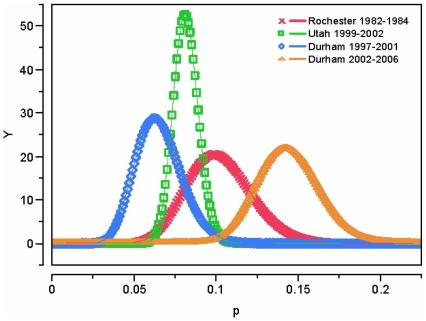
Figure 2. Bayesian Analysis of SBIs among FWLS Infants, 1997–2001 and 2002–2006.
The graph represents the probability of SBI based on data from the early and later periods of this study compared with the Rochester data as well as data on FWLS infants from Utah [5], [15]. The probability curve from the data from the later period centers at approximately 14.4% whereas the other three curves all overlap between 5–10% probabilities.

