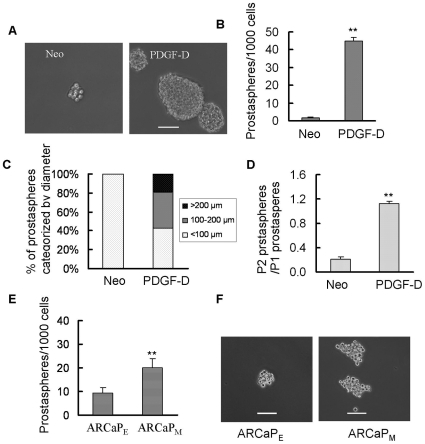
Figure 2. Prostaspheres were increased in cells having EMT phenotype.
(A) Prostaspheres from PC3 Neo and PC3 PDGF-D cells were photographed and shown (bar, 100 µm). (B) The numbers of prostaspheres were counted under microscope. (C) Prostaspheres were photographed and the size of prostaspheres in diameter was measured using software image analysis program Scion Image. (D) The prostaspheres (P1) were collected and re-plated at a density of one cell per well in 96-well plate with ultra low attachment. After 12 days of incubation, the numbers of prostaspheres (P2) were counted under a phase contrast microscope. (E) The numbers of prostaspheres from ARCaPE and ARCaPM cells were counted under microscope. (F) Prostaspheres from ARCaPE and ARCaPM cells were photographed and shown (bar, 100 µm). **, p<0.01 compared to Neo or ARCaPE cells (Neo: PC3 Neo cells, PDGF-D: PC3 PDGF-D cells).

