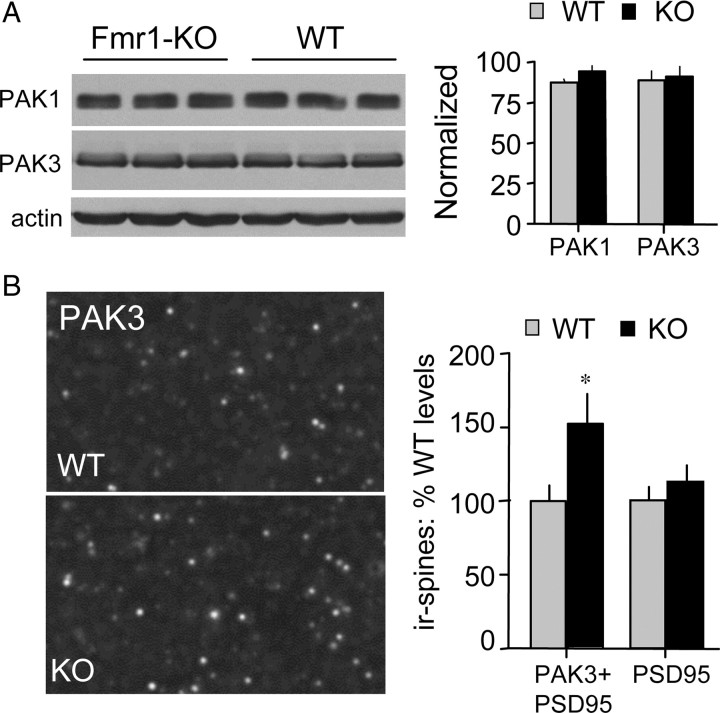
Figure 5.
Abnormal PAK3 levels in Fmr1-KO spines. A, Left, Western blots show total levels of PAK1, PAK3, and actin in hippocampal homogenates from Fmr1-KO and WT mice. Right, Quantitative analysis shows no difference in hippocampal PAK levels (immunoreactive band ODs) between genotypes; levels normalized to β-actin (n = 4/group). B, Left, Photomicrographs show PAK3 immunolabeling of spine-like puncta in CA1 str. radiatum of WT and Fmr1-KO mice. Right, Bar graph shows quantification of PAK3+ spines (i.e., PAK3+ PSD95 double-labeled puncta) and total numbers of PSD95+ spines in the CA1 str. radiatum sample field from Fmr1-KO and WT mice (n = 5–8 mice/group). Results are expressed as percentage of mean WT control values; *p < 0.05, Tukey's HSD post hoc, KO vs WT group.

