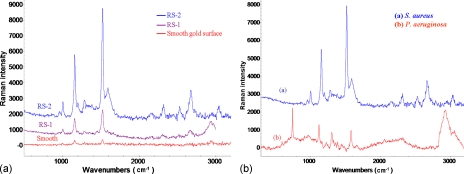
Figure 4.
(a) The Raman spectra of S. aureus detected by different roughened electrode surfaces. The purple curve, blue curve, and red curve were obtained from the RS-1, the RS-2, and the smooth Au surface, respectively. (b) The measurement results of S. aureus [curve (a)] and P. aeruginosa [curve (b)] show distinct SERS spectra that are promising for fingerprint discrimination.

