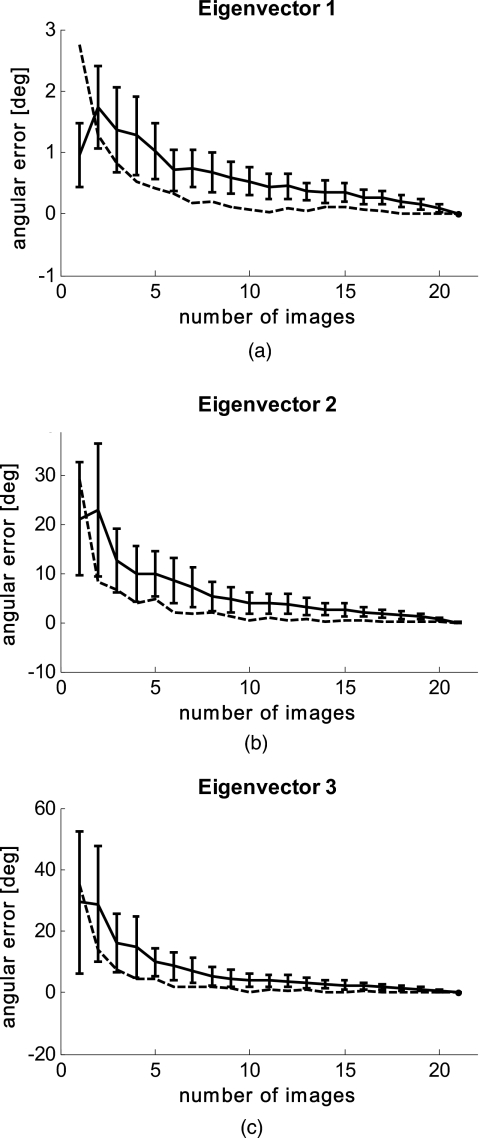
Figure 7.
Validity of image summation for PCA. Solid lines are the average distance from local ensemble plus their standard deviation. Dashed lines are the distance of local ensemble average from “truth” (21 image ensemble). (a) shows data from eigenvector 1; (b) from eigenvector 2; and (c) from eigenvector 3.

