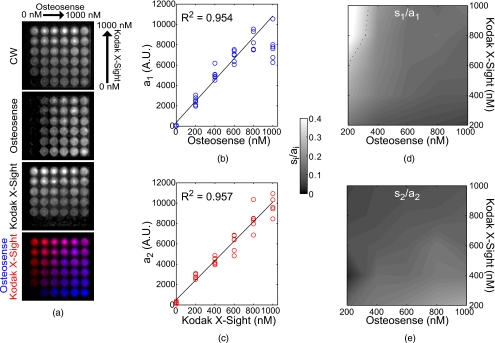
Figure 5.
Multiwell separation of Osteosense and Kodak X-Sight. A multiwell plate was filled with Osteosense and Kodak X-Sight in orthogonal axes, from 0 to 1000 nM, in 200-nM steps. The multiwell plate was imaged in planar fluorescence mode, and subsequent images were fit for the lifetime components of 1126 (a1, Osteosense) and 1376 ps (a2, Kodak X-Sight), which were obtained from wells containing only a single fluorophore. (a) cw and recovered amplitude components of the multiwell plate. In the biexponential frame (bottom), Kodak X-Sight is in red, Osteosense is in blue. (b) and (c) Recovered component amplitudes (arbitrary units, AU) and linear fit to fluorophore concentration; correlation is shown in top left of each graph. (d) and (e) Amplitude uncertainty (si∕ai), for (d) Osteosense and (e) Kodak X-Sight. (Color online only.)

