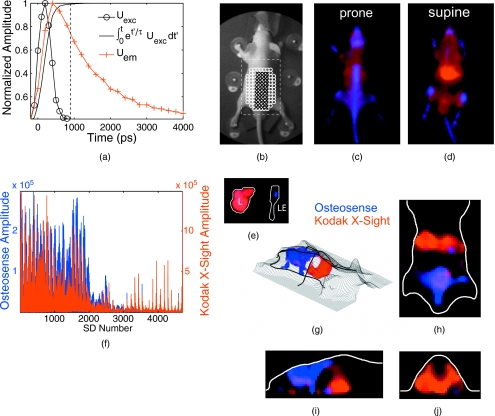
Figure 8.
Tomography of two fluorophores. Nude mice were administered Osteosense (24 h prior) and Kodak X-Sight (1 h prior) and imaged with time-resolved planar fluorescence and tomography. Tomographic reconstructions used excitation (750∕40-nm BP filter), emission (800-nm LP filter), and surface topography measurements, for 44 sources and 107 detectors. (a) Representative time-resolved data for tomographic reconstructions. The product of the excitation measurement (Uexc) and the fluorophore exponential was integrated over time , and all time points after 99% of the max (dashed line) were used for lifetime fitting. (b) White light planar reflectance image with source (black “x”) and detector locations (white “o”). The reconstructed volume is indicated with the dashed white box. (c) through (e) Unmixed planar fluorescence images with Osteosense (blue) and Kodak X-Sight (red). Postmortem organs (liver L; amputated lower extremity LE) are shown in (e). (f) Recovered amplitude components for 44×107 SD pairs. (g) 3-D rendering of surface (grid) and the Osteosense and Kodak X-Sight distributions. The location of slices in (g) through (h) is shown in bold black lines. (h) through (j) Slices from lifetime-separated reconstruction. Surface boundaries are indicated in white.

