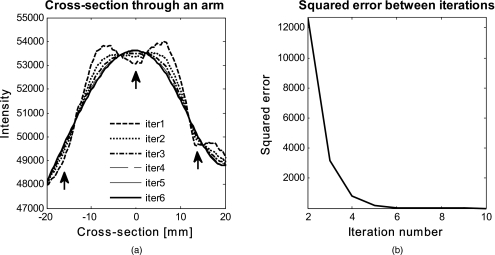
Figure 10.
Effect of multiple iterations on the goodness of fit of curvature is shown in this graph. (a) shows a cross section through the curvature fit for all six iterations. Black arrows indicate the location of veins. It can be seen that the effect of veins disappear after several iterations, leaving a smooth curvature. The L-curve in (b) shows the squared error against number of iterations.

