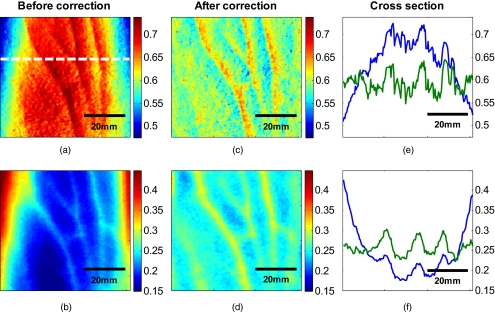
Figure 12.
Effect of curvature correction on quantification of (a) and (c) fraction blood oxygenation and (b) and (c) fraction blood volume. Reconstruction results (a) and (b) before curvature correction are clearly biased by it. Results after correction (c) and (d) do not show this effect, which can be seen in more detail in the cross sectional plots shown in (e) and (f), with uncorrected in blue and corrected in green. The cross sections shown are indicated by the dotted line in (a). Detailed assessment of tissue chromophore concentration was made possible. (Color online only.)

