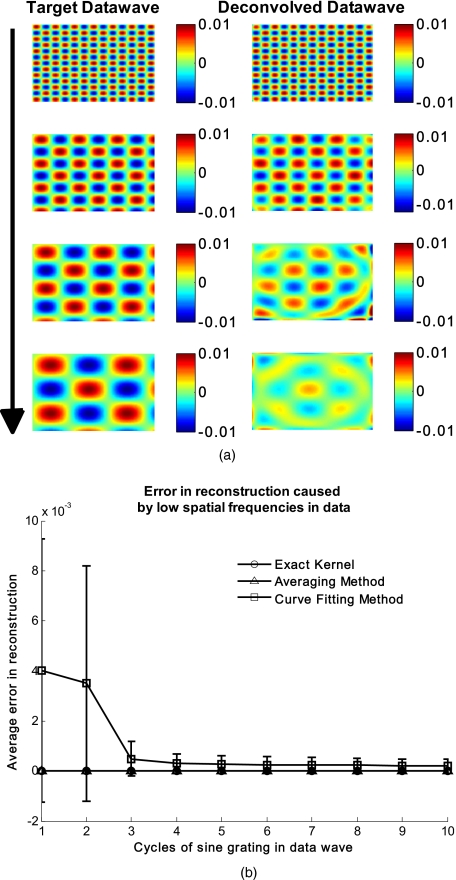
Figure 4.
(a) Gradual degradation of the curvature correction using the curve fitting approach when data with decreasing spatial frequencies (top to bottom) are applied. The left column shows the data waves and the right column the deconvolved ones. (b) Error in reconstruction caused by low spatial frequencies in data. The dependence of spatial frequency of the data wave for the curve fitting approach is pointed out by plotting the average error in reconstruction against the number of cycles of the sine grating in the data wave. As expected, the averaging approach is not affected by the varying spatial frequency.

