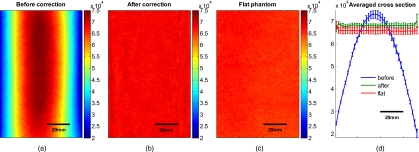
Figure 7.
Curvature correction based on curve fitting on the cylindrical phantom without data content and compared to the flat phantom. (a) shows the curvature uncorrected intensity image, (b) the curvature corrected intensity image, and (c) shows the flat phantom. (d) shows the averaged cross section of (a), (b), and (c) with error bars given by the standard deviation over all rows.

