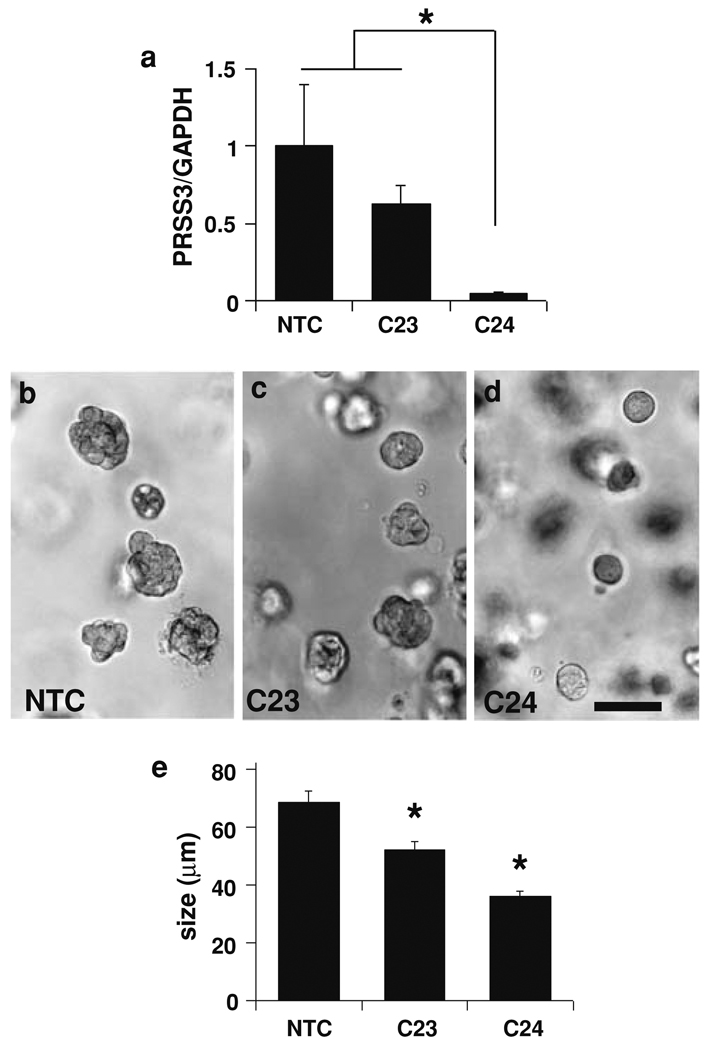
Fig. 2.
Effect of PRSS3 knockdown on malignant growth of T4-2 cells in 3D culture. a Cells transduced with lentiviral shRNA vectors C23 or C24 targeting PRSS3 revealed lower transcript levels in 2D cultures compared with cells transduced with a non-target control vector (NTC), as assessed by real-time qRT/PCR. Values represent normalized PRSS3/GAPDH transcript levels ± SEM. * P < 0.05 (unpaired t test). b–e Cells transduced with control, C23, or C24 vectors were grown in Matrigel for 7 days, then photographed and assessed for colony size. Photographs of representative fields show a reduction of colony size in cultures transduced with C23 (c) and C24 viruses (d) relative to control cultures (b), in a pattern that correlates with PRSS3 transcript levels. Scale bar, 100 µm. e Colony size was significantly reduced for both C23 and C24 transduced cultures relative to control cultures; data represented as mean ± SEM. * P < 0.001 (unpaired t test)

