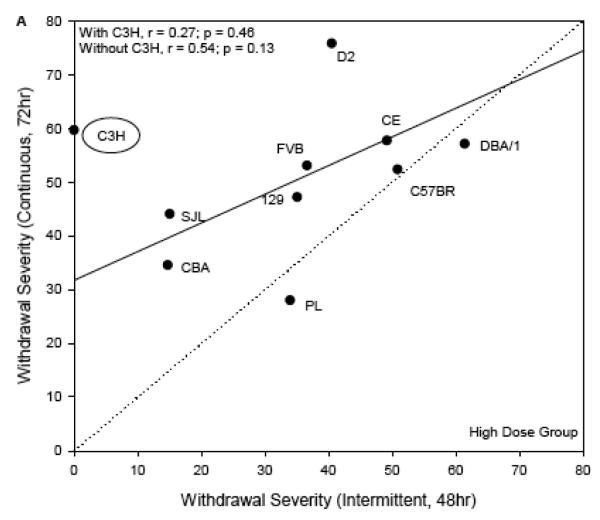
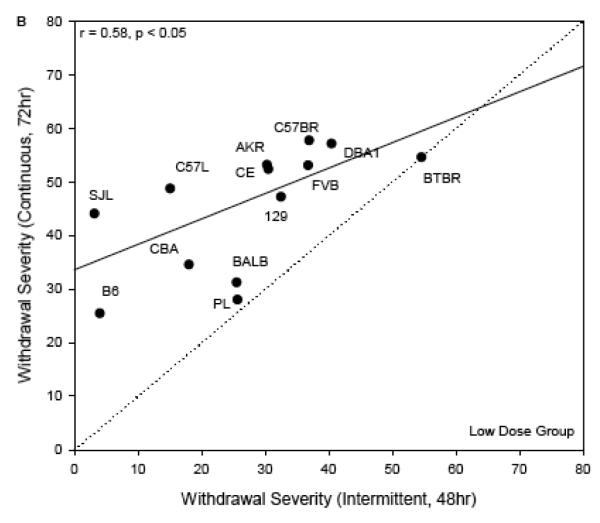
Figure 4.
Withdrawal severity in the current experiment (ΔAREA25, abscissa), plotted versus comparable data following chronic continuous vapor inhalation for 72 hr (ordinate; Metten & Crabbe, 2005). Each point represents a strain mean value. The regression lines (solid line) and one-to-one lines (dotted line) are shown. Panel A: High Dose chronic intermittent exposure. The regression line shown was computed without the C3H/HeJ strain as discussed in the text. Panel B: Low Dose chronic intermittent exposure.


