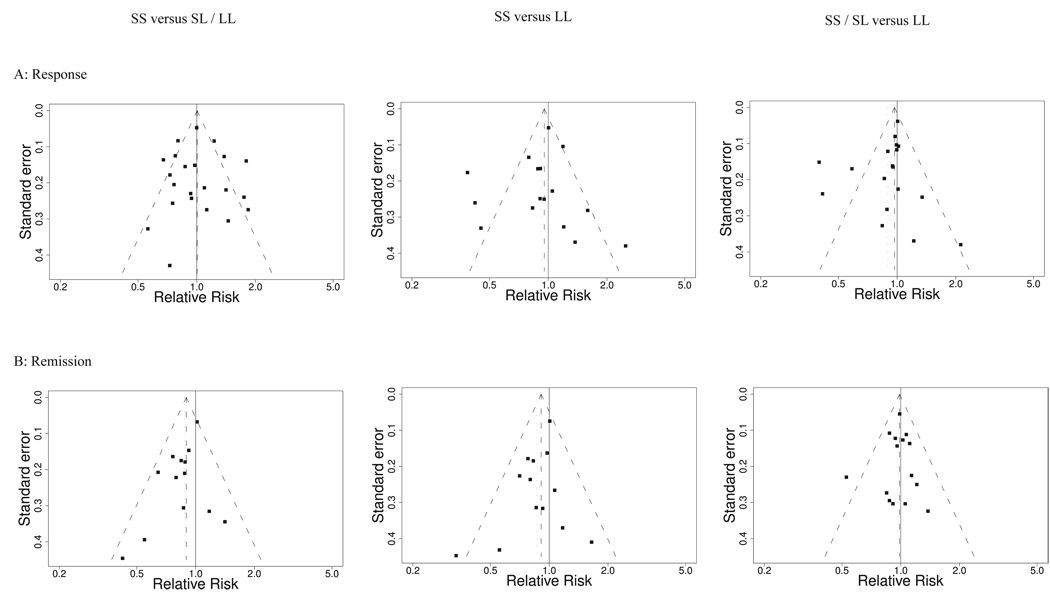
Figure 2.
Funnel plots of effect estimate as relative risk against its standard error for (a) response and (b) remission comparisons of SS versus SL/LL (left), SS versus LL (middle), and SS/SL versus LL (right) with random effects estimate and 95% CI shown. Statistically significant asymmetry for remission rate comparisons of SS versus LL (p=0.02) and SS versus SL/LL (p=0.02).

