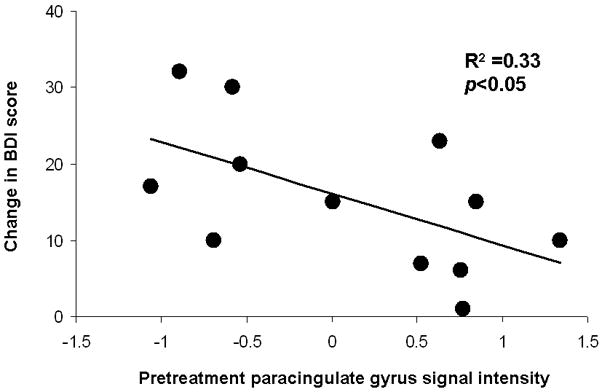
Figure 4.

Scatterplot depicting relations between change in BDI score (i.e., Pre-treatmement-Post-Treatment) and pretreatment paracingulate gyrus (cluster depicted on the left side of Figure 3) signal intensity from the [Targets within Sad Blocks] minus [Targets within Neutral Blocks] contrast in the MDD group.
