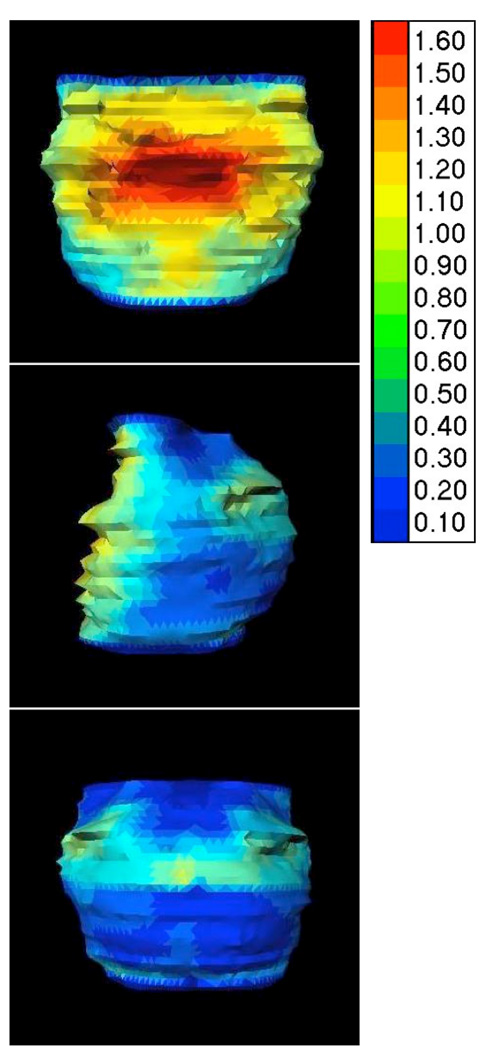
Figure 5.
Intra-observer variation. The intra-observer variation (SD) is shown in an anterior, sagittal and posterior view for the observers who delineated the case twice without any changes in between (Group_B). Group standard deviation of distance between equivalent points for Scan1 and Scan2 for each user are shown as a color scale to the right side of figure (in cm).

