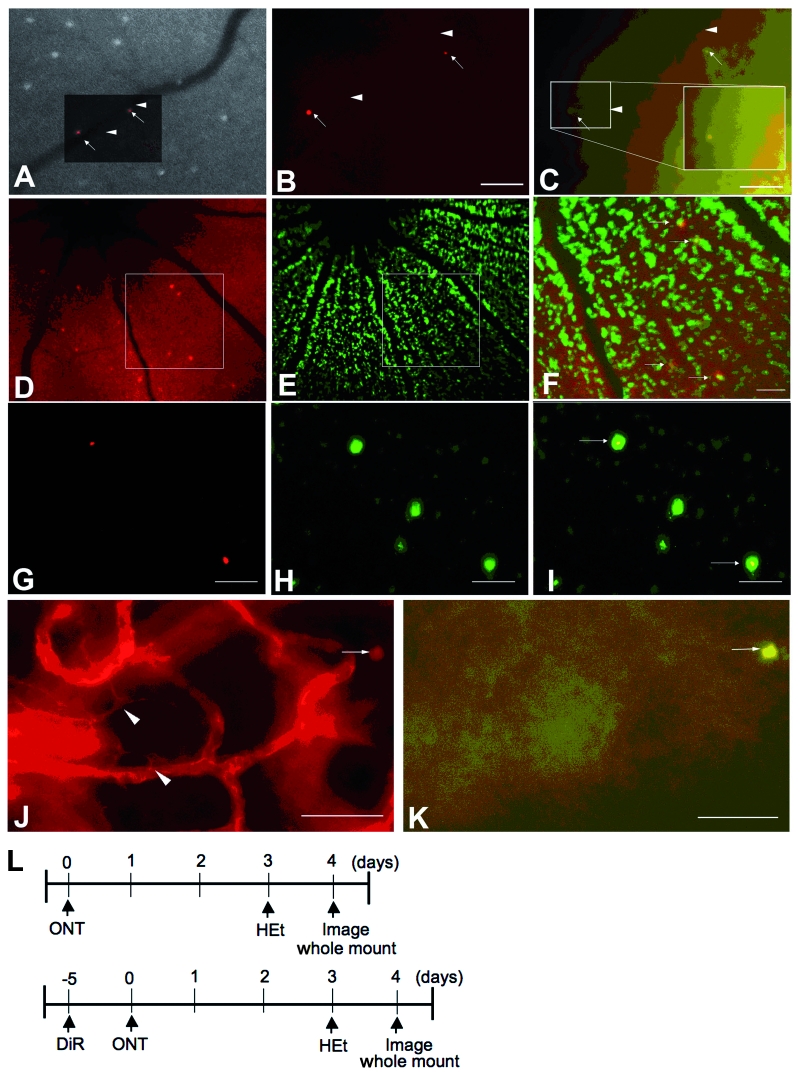
Figure 5.
Axotomized RGCs that are fluorescent by CSLO imaging of HEt contain OH-Et, the product of HEt and superoxide, based on anatomical correlation of in vivo and ex vivo images studied by fluorescence microscopy. (A) Overview of epifluorescence microscopy of a whole-mounted retina overlaid on the corresponding CSLO image. Arrows indicate fluorescent cells. Arrowheads indicate corresponding locations on the same vessel, used for registration of images. (B) Whole-mounted retina imaged by epifluorescence microscopy using 560 ± 20 nm excitation to detect both ethidium and OH-Et in axotomized RGCs (arrows). (C) Whole-mounted retina imaged by epifluorescence microscopy using 395 ± 5.5 nm excitation to detect OH-Et alone in axotomized RGCs (arrows). (D–I) Co-localization of OH-Et by CSLO in vivo (D–F) or by fluorescent microscopy in retinal whole mounts (G–I) with RGCs retrogradely labelled with DiR. D and G, OH-Et, pseudocoloured red. E and H, DiR, pseudocoloured green. (F) Merged image of the insets in D and E. (I) Merged image of G and H. Arrows indicate OH-Et located in RGCs. (J and K) Microglia stained with the rhodamine-conjugated GSL-I. (J) Microglia (arrowheads) with characteristic morphology can be detected using a non-selective filter set (560 ± 20 excitation, 630 ± 30 emission) that detects rhodamine-GSL-I, OH-Et and ethidium. The oxidative product of HEt (arrow) is present on this image but localizes out of the plane of focus. (K) OH-Et positivity detected with a selective filter set (395 ± 5.5 excitation, 562 ± 20 emission) in the same field as J. Microglia are not positive for OH-Et. Scale bar: 50 µm. (L) Flowchart of experiments for A–C, J and K (top). Flowchart of experiments for D–I (bottom). ONT = optic nerve transection.

