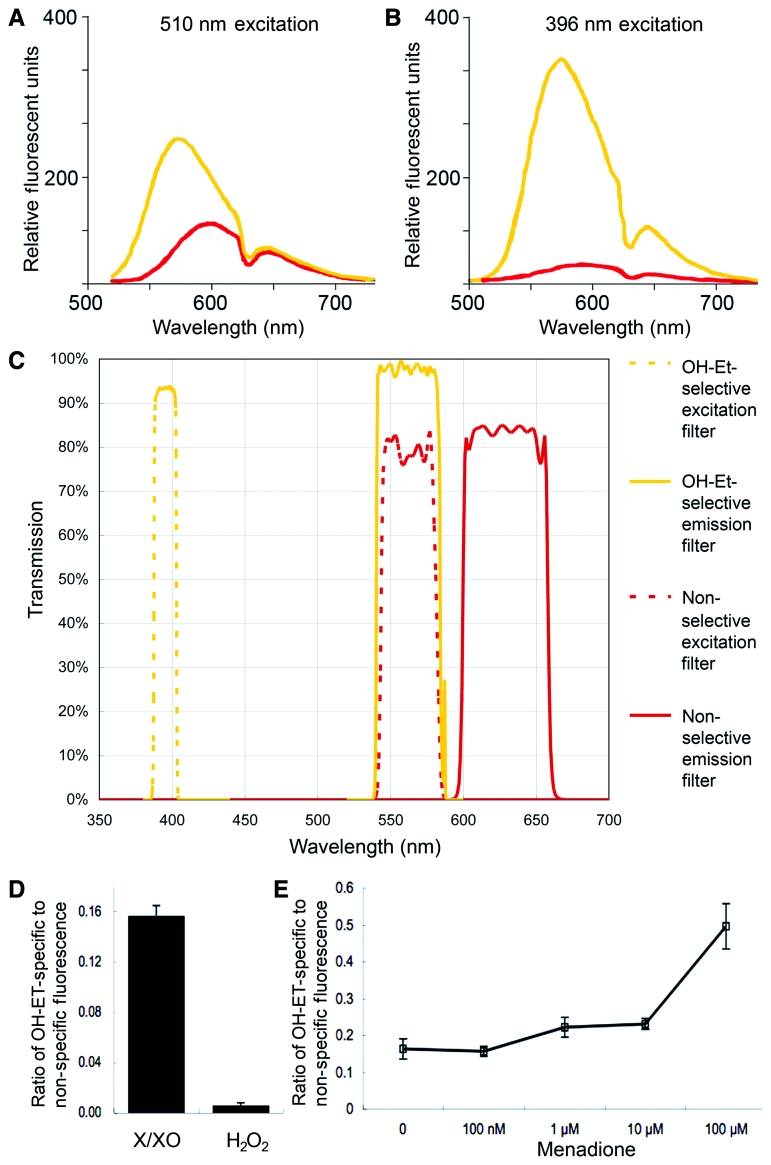
Figure 6.
OH-Et can be detected by fluorescence microscopy. (A and B) The emission spectrum of OH-Et (yellow) and ethidium (red) excited at 510 nm (A) and 396 nm (B), redrawn from (Robinson et al., 2006). (A) When excited at 510 nm, ∼40% of OH-Et fluorescence overlaps with ethidium fluorescence. (B) When excited at 396 nm, only 10% of OH-Et fluorescence overlaps with ethidium fluorescence. (C) Spectral curves of OH-Et-selective filters (yellow) and non-selective filters (red). The latter do not distinguish the OH-Et signal from the ethidium signal. (D) Imaging the products of HEt oxidized by either X/XO or H2O2 on a microscope slide. The fluorescence intensity with the OH-Et-selective (395 ± 5.5 nm) excitation filter was compared to that with the non-selective 560 ± 20 nm excitation filter. The OH-Et-selective filter resulted in more fluorescence emission with the reaction products than did the non-selective filter. (E) RGC-5 cells treated with menadione, which produces superoxide by redox shuttling, were reacted with HEt. The OH-Et-specific excitation resulted in significant RGC-5 cell fluorescence when treated with menadione at 1 µM or higher concentrations.

