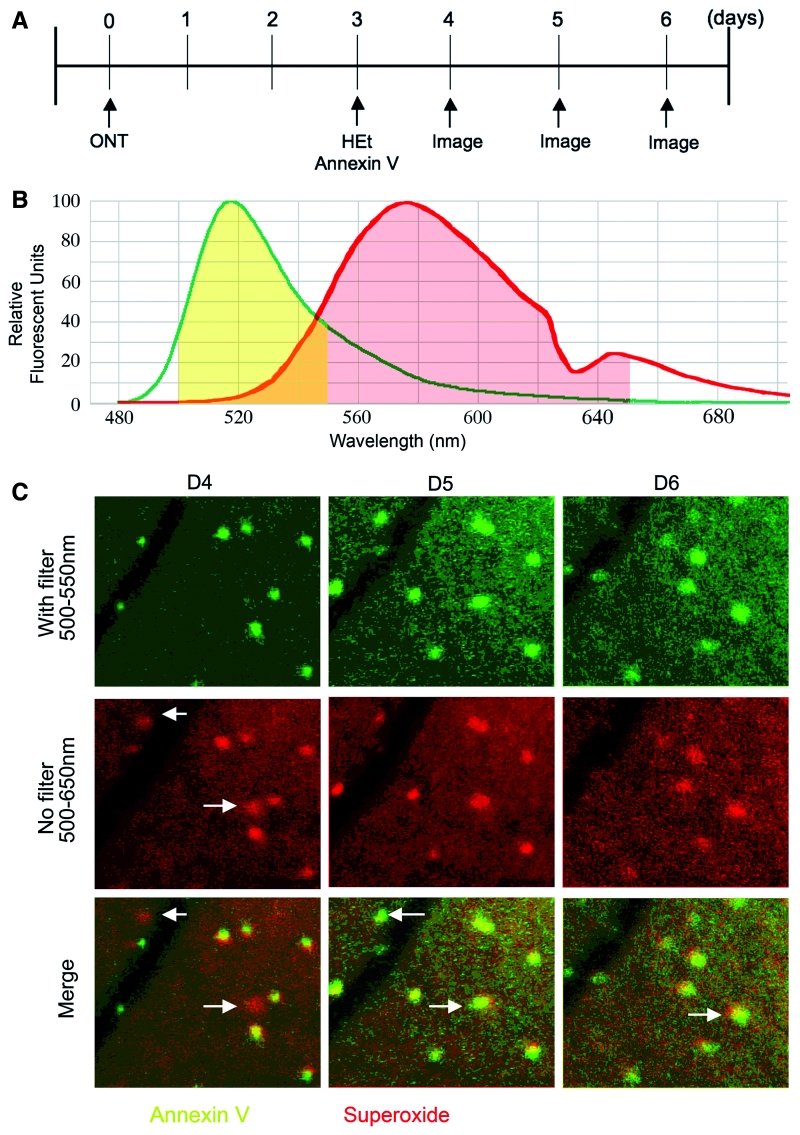
Figure 9.
(A) Flowchart of experiments. (B) Spectral emission curves of Alexa Fluor 488-annexin V (green line) and OH-Et (red line; redrawn from Robinson et al., 2006). The yellow area represents that part of the spectrum passed by the 550 nm external short-pass filter and detected by the CSLO sensor (500–650 nm). The red area is the spectrum detected by the CSLO sensor without the short-pass filter. OH-Et fluorescence is therefore poorly detected, compared to Alexa Fluor 488-annexin V, when the 550 nm short-pass filter is used. These results were confirmed using rats injected with HEt alone. (C) Superoxide generation precedes RGC apoptosis after axotomy. RGCs were double-labelled for OH-Et and annexin V, and longitudinally imaged at 4, 5 and 6 days after axotomy. Retinal CSLO images were taken either with or without a short-pass (550 nm) filter, in order to distinguish the Alexa Fluor 488-annexin V emission from the OH-Et emission. With the short pass filter, only annexin V is detected (pseudocoloured green). Without the short pass filter, both annexin V and OH-Et are detected (pseudocoloured red). The merge indicates annexin V-positive cells as yellow and OH-Et-positive cells as red. On Day 4 after transection (D4) the cells indicated with the arrows were OH-Et-positive, and became annexin V-positive the next day (D5). At Day 6 after transection (D6), one cell became annexin V-negative, and the other remained annexin V-positive. ONT = optic nerve transection.

