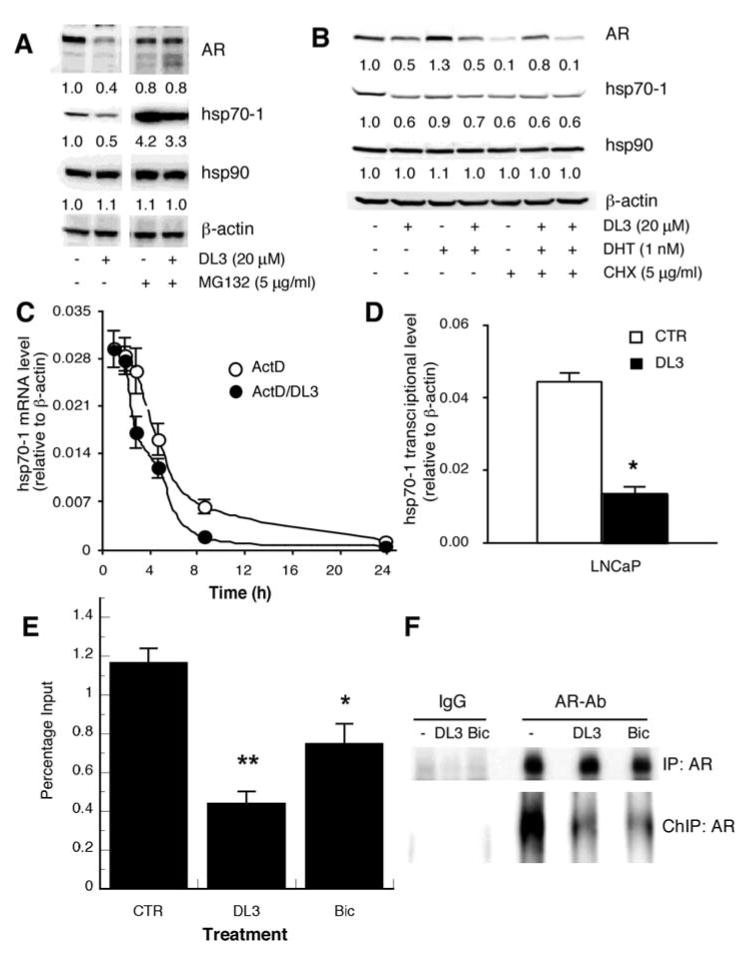
Figure 4.

Mechanistic study on DL3-induced hsp70-1 downregulation. (A) LNCaP cells in medium supplemented with 10% FBS were treated for 16 h with 20 μM of DL3 and/or 5 μg/ml of MG132. (B) LNCaP cells in medium supplemented with 10% SFBS were treated for 24 h with 20 μM of DL3, 1 nM of DHT, and/or 5 μg/ml of CHX. (C) LNCaP cells were treated for different times with 5 μg/ml of ActD in the absence or presence of 20 μM of DL3. Total RNA was extracted and analyzed by qRT-PCR. (D) LNCaP cells, incubated in medium or treated with 20 μM of DL3, were lyzed and mixed with the same volume of 0.6 M isolation sucrose buffer. Cell nucleus pellets obtained were incubated in transcription reaction buffer. Total RNA in the reaction mixture was extracted, and hsp70-1 and ß-actin mRNA was assessed by real-time RT-PCR. Samples without in vitro transcription reaction were used as controls (not shown). (E) LNCaP cells, treated for 4 h with 20 μM of DL3 or Bic, were fixed in 1% formaldehyde. After washing and incubation in glycine, cells were scrapped into PBS supplemented with 5 mM PMSF, pelleted, resuspended in SDS lysis buffer, and sonicated to sheer DNA. AR-chromatin-transcription factor complex was precipitated with antibodies to AR with IgG from normal rabbit as a negative control. With 1:150 dilution of total DNA as a positive control (total input), DNA obtained from the immunoprecipitation was analyzed by using qPCR. (F) A portion of the ChIP samples was analyzed by immunoblotting to evaluate AR levels. In a parallel setting, total cell lysates were precipitated with the same AR antibody to evaluate the total cellular AR level in each treatment group.
