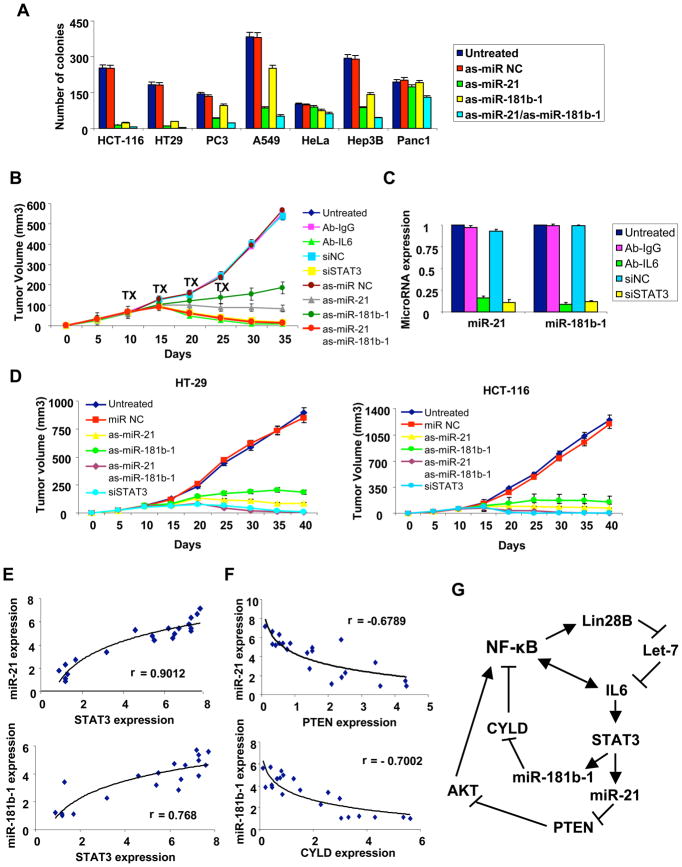
Figure 7. STAT3-regulated microRNAs in cancer cells, xenografts and cancer patients.
(A) Colony formation assay in colon (HCT-116, HT-29), prostate (PC3), lung (A549), cervical (HeLa), hepatocellular (Hep3B) and pancreatic (Panc1) cancer cell lines treated with antisense microRNA negative control, antisense-miR-21, antisense-miR-181b-1 or their combination. The data are presented as mean ± SD of three independent experiments. (B) Tumor growth (mean ± SD) of ER-Src cells after i.p treatment (days 10, 15, 20, 25) with Ab-IgG, Ab-IL6, siRNA negative control, siRNA against STAT3, antisense miR-NC, antisense-miR-21 and/or antisense-miR-181b-1. (C) MiR-21 and miR-181b-1 expression levels from tumors derived from the experiment described above. (D) Tumor growth (mean ± SD) of HCT-116 and HT-29 colon cancer cells after intraperitoneal treatment (days 10, 15, 20, 25) with microRNA negative control or antisense-miR-21 or antisense-miR-181b-1 or siRNA against STAT3. (E) MiR-21, miR-181b-1 and STAT3 mRNA expression levels in colon adenocarcinomas, with each data point represents an individual sample and a correlation coefficients (r) indicated. (F) MiR-21, miR-181b-1, PTEN and CYLD mRNA expression levels in colon adenocarcinomas. (G) Model of the inflammatory positive feedback loop that mediates the epigenetic switch between non-transformed and transformed cells.

