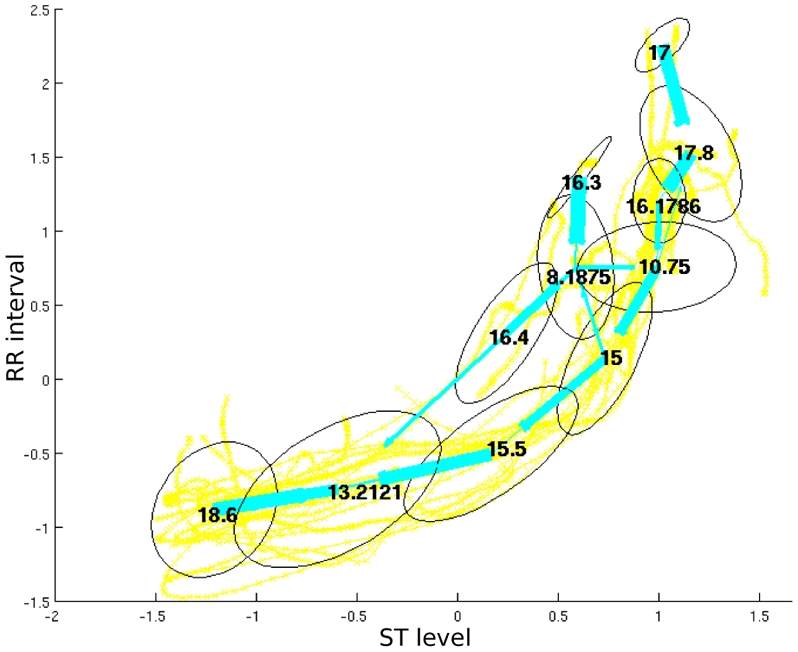
Fig. 3.

ST levels/RR-intervals normalized trajectories of 15 ST-IS episodes modelled with a CDHSMM: the ellipses represent the bivariate gaussians assigned to each state, the straight lines represent the transitions between the states, the numbers into the ellipses are the state time duration means.
