
FIGURE 2. Hierarchical response of effector functions in epitope-specific T cells.
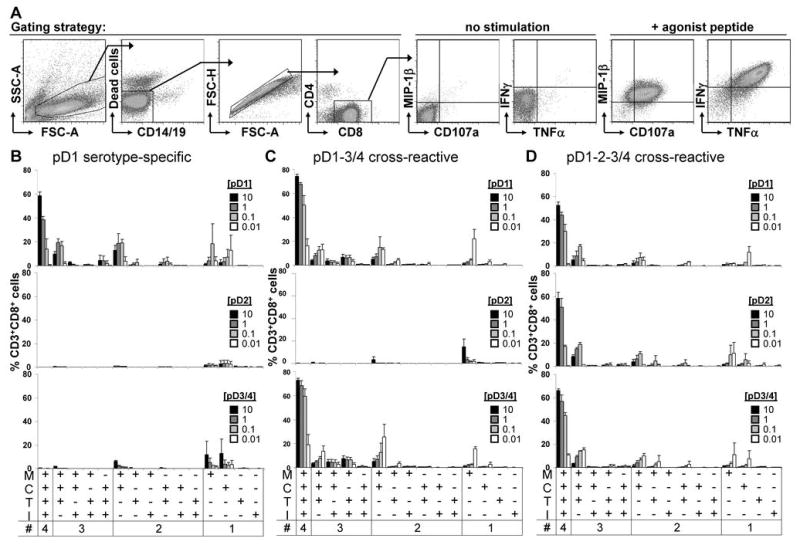
(A) Gating strategy and representative flow plots of a cell line in response to the absence or presence of agonist peptide. (B) pD1 serotype-specific, (C) pD1-3/4 cross-reactive, and (D) pD1-2-3/4 cross-reactive cell lines were stimulated with each of the peptide variants in intracellular cytokine staining assays. All possible combinations of the four effector functions (MIP-1β (M), TNFα (T), and IFNγ (I) production as well as degranulation (C), as determined by CD107a staining) are displayed across the x axis. Mean frequencies of responding CD8+ T cells of 10E11 (n = 2), 10C11 (n = 4), and 10B8 (n = 2) are shown. Peptide concentrations are shown in μg/mL.