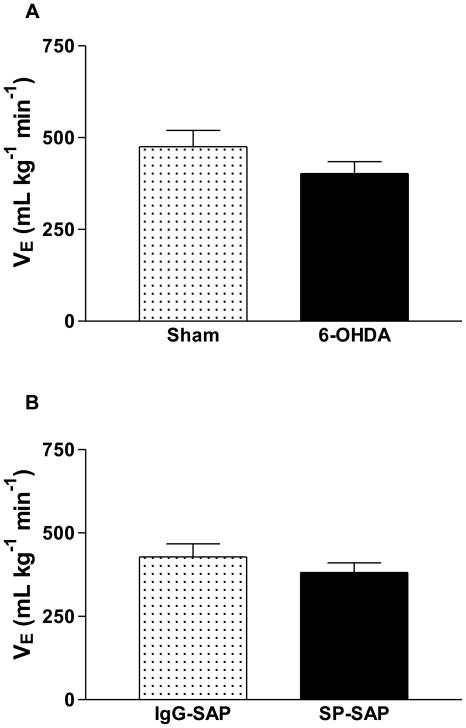
Figure 1.
A. Minute ventilation (VE) of the sham (n=8) and 6-OHDA rats (n=10) groups during normocapnia (adapted with permission from Biancardi et al., 2008). B. Minute ventilation (VE) of the IgG-SAP rats (control, n=9) and SP-SAP (n=8) groups during normocapnia (adapted with permission from Carvalho et al., in press). Values are means ± SEM. There is no difference between groups in both A and B.

