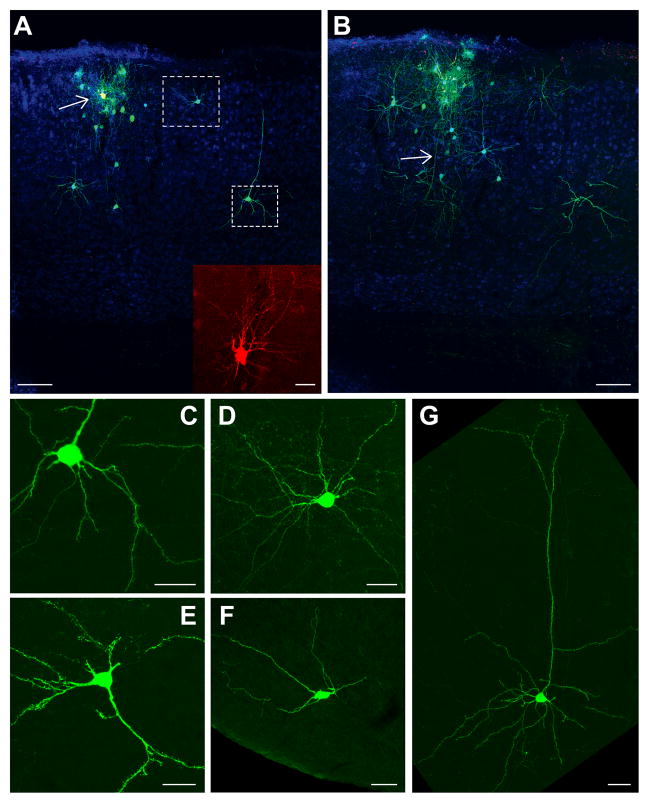
Figure 4. Tracing the Monosynaptic Inputs to a Single Mammalian Neuron In Vivo.
(A) A single layer 2/3 neuron (yellow neuron indicated by white arrow) in mouse visual cortex was targeted for the single cell tracing strategy using the parameters and reagents schematically represented in Figure 1. Transfection of electroporated plasmids was confirmed by expression of mCherry in the neuron (inset) and by infection of the neuron by SADΔG-EGFP(EnvA), and glycoprotein mediated transsynaptic spread of rabies virus to presynaptic neurons, where the virus expressed EGFP (green). A cluster of a variety of interneuron cell types and pyramidal cells was found surrounding the electroporated neuron shown in (A) and extending onto adjacent 40 μm sections (for example (B), some sections not shown). Many other neurons were also found throughout the brain, located several hundred microns to over a centimeter away from the host neuron (C–G). Regardless of distance from the host neuron, the morphology of neurons was labeled in intricate detail, and it was possible to characterize the cell type of labeled neurons based on morphology. A total of 97 neurons were labeled transsynaptically by the virus in this experiment. All panels in this figure are from the same animal. Blue is NeuN staining of neuronal nuclei.
(B) Adjacent medial section to (A). Dendrites from the electroporated neuron (yellow) can be seen extending onto this section, as well as the neuron’s descending axon (indicated by white arrow).
(C) Higher magnification image of the pyramidal neuron indicated by the lower white box in (A). This neuron was located over 400 μm caudal to the host neuron, in the same lateral-medial plane. The detailed morphology of the neuron is clearly visible, with complete filling of the neuron’s dendritic spines and axon. This image only shows a small fraction of the elaboration of the neuron’s processes. Some of these features are visible in (B, similar location to in (A)).
(D) Higher magnification image of the interneuron indicated by the upper white box in (A). This neuron was located over 200 μm caudal to the host neuron, in the same lateral-medial plane. The complete filling of the neuron’s dendritic tree permitted characterization of the neuron as a layer 2/3 multipolar inhibitory neuron (more dendrites visible in (B)). Dozens of other interneurons were found in this experiment, representing a variety of cell types.
(E) A projection neuron found several hundred microns away from the host neuron in retrosplenial cortex.
(F) A neuron transsynaptically labeled in hypothalamus. Despite the over 1 cm distance from the host neuron, the brightness of label in this cell was comparable to the other neurons labeled throughout the brain.
(G) A visual cortical projection neuron labeled in complete detail, located over 200 μm lateral to the host neuron. Scale bars: 100 μm in (A), (B), 25 μm inset in (A) and (C)–(G).

