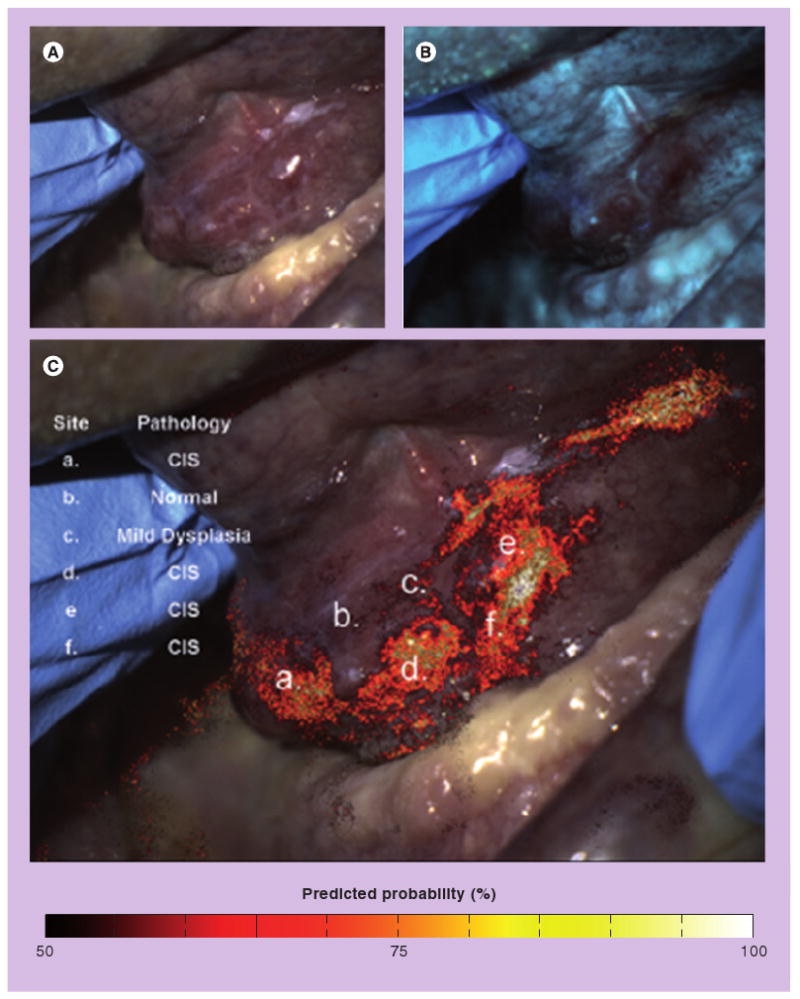
Figure 3. Automated analysis of autofluorescence images.

(A) A white light image of the floor of the mouth with a histopathologically confirmed dysplasia and carcinoma in situ. (B) 405 nm excitation fluorescence image showing areas with decreased autofluorescence. (C) White light image with disease-probability map showing the predictive probability of a neoplastic lesion superimposed. The disease-probability map indicates the probability that, based on the ratio of red:green fluorescence intensity, the underlying tissue is neoplastic. Letters indicate specific locations where pathology is known, and results of digital image analysis show good agreement with histology. Roblyer et al. provided a detailed explanation of how the map was developed and evaluated in a high-prevalence setting [51]. The high sensitivity and specificity obtained suggest that such disease-probability maps can be used to help objectively delineate the presence and extent of lesions, highlighting suspicious areas that may require further examination. However, further studies in low-prevalence populations are required to assess performance with potentially confounding lesions, such as benign inflammation.
Reprinted with permission from [51].
