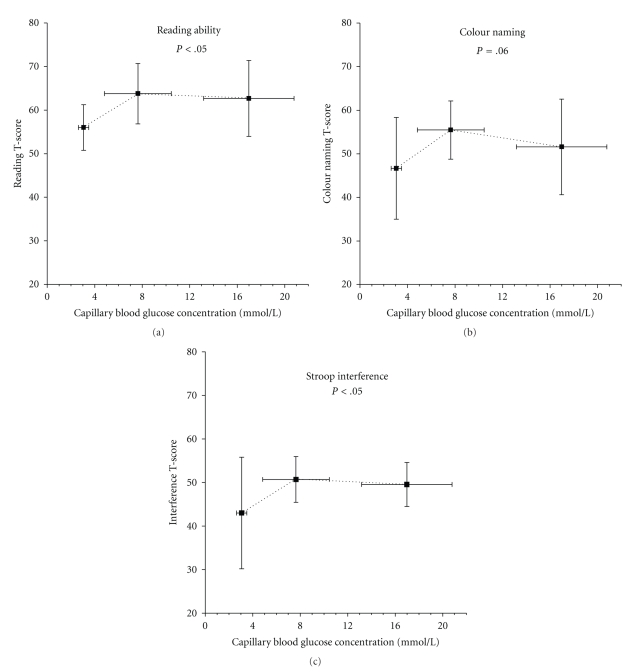
Figure 3.
Stoop skill performance scores at each of the three categories of glycemia. Scores are shown as a percentage of personal best during the week. Scores during hypoglycemia were lower than euglycemia or hyperglycemia in reading ((a) P < .05), color recognition ((b) P < .05), and interference ((c) P = .06). See methods section for a complete description. Mean ± SD.

