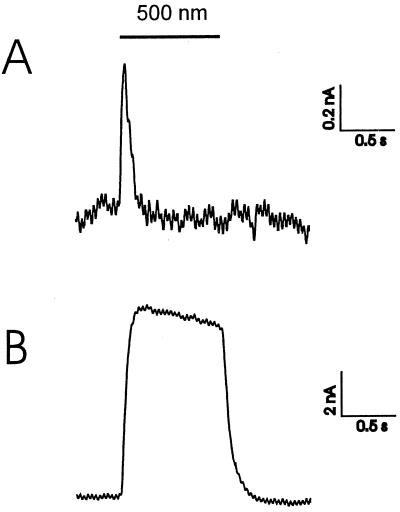
Figure 2.
Voltage–clamp signals of pSRII at −40 mV (50 Hz filtering). (A) The photocurrent of pSRII at pH 7.6 (90 mM NaCl, 5 mM BaCl, 20 mM TEA⋅Cl, 10 mM Mops), whereas the lower trace given in B was recorded with the same oocyte at pH 5.6 and the presence of 50 mM sodiumazide (40 mM NaCl, 5 mM BaCl, 20 mM TEA⋅Cl, 10 mM Mes).

