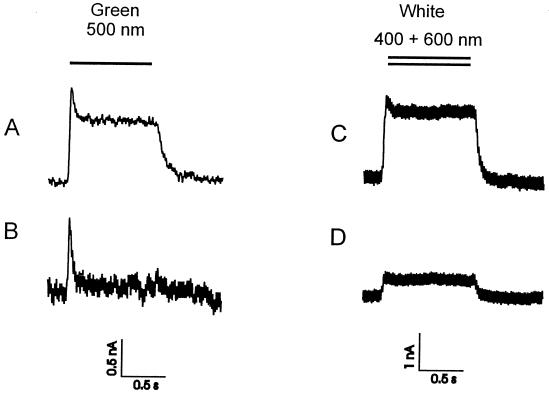
Figure 3.
Photocurrent of pSRII-F86D (A and B) and SRI (C and D) in the absence (A and C) and presence of their corresponding transducers pHtrII and pHtrI (B and D). The voltage–clamp signals have been recorded 4 days after the injection of the SR's mRNA as well as the SR's/Htr's mRNA at a membrane potential of −20 mV (20 Hz filtering) for SRI and SRI/HtrI and −40 mV (50 Hz filtering) for pSRII-F86D and pSRII-F86D/pHtrII. The bath solution consisted of 90 mM NaCl, 5 mM BaCl, 20 mM TEA⋅Cl, 10 mM Mops, pH 7.6.

