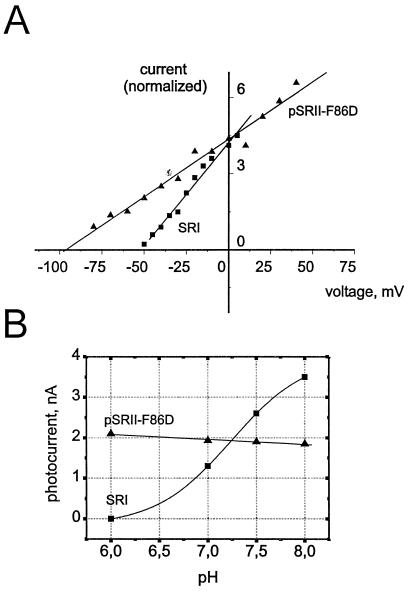
Figure 4.
Voltage- (A) and pH-dependence (B) of the SRI and pSRII-F86D photocurrents. Triangles represent data points of pSRII-F86D (normalized to SRI current at 0 mV), squares are indicative for SRI. Both pigments show a steep linear current/voltage-dependence and the signals do not invert at any observed potential (A). The pH-dependence (B) was recorded at a constant membrane potential of −20 mV (SRI) or −40 mV (pSRII-F86D). In the case of pSRII-F86D, only a slight linear increase of the photocurrent with increasing proton concentration is visible, whereas SRI shows a sigmoidal pH dependence. The deflection point corresponds to the pKa 7.2 (Boltzmann fit; Imin = −0.16 ± 0.2, Imax = 4.0 ± 0.3, pH (Imax/2) = 7.2 ± 0.1).

