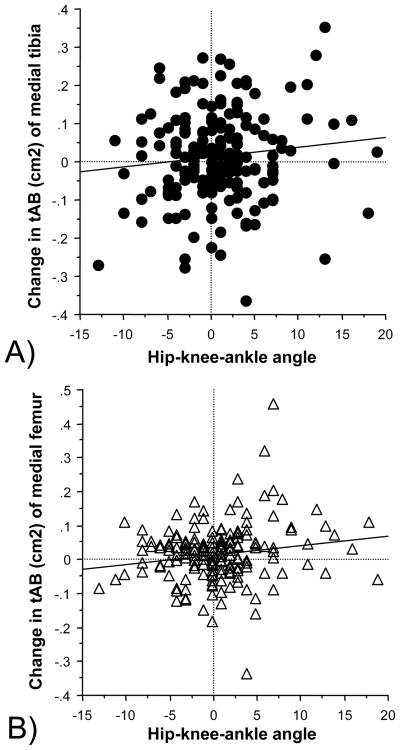
FIG 4.
Scatter plots showing the correlation between the hip-knee-ankle angle (alignment) and the increase in the subchondral bone surface area (tAB) between baseline and follow up (in cm2 normalized to one year):
A) Medial tibia (MT)
B) Medial weight-bearing femur (cMF)
Negative values for the hip-knee-ankle angle show valgus malalignment and positive values varus malalignment

