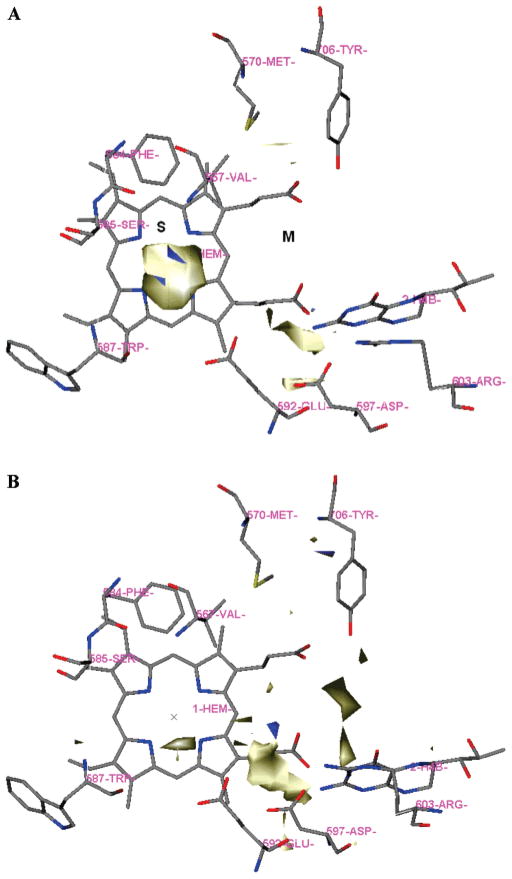
Figure 3.
Results of GRID analysis of the substrate binding site of nNOS (PDB: 1p6i). The residues and cofactors (heme and H4B) are represented in an atom-type style. The S and M pockets are indicated. A: GRID contours of the C3 probe at an energy level of −3.50 kcal/mol. B: GRID contours of the N3+ probe at an energy level of −9.60 kcal/mol; “×” represents the position of the heme iron atom.

