
Fig. 5.
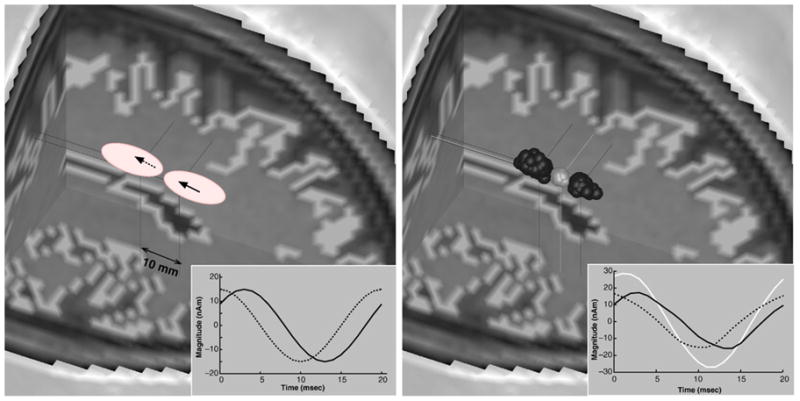
Left: Original two dipole problem with closely located sources. Right: Comparison of MEG analysis (bright gray) and combined MEG/fMRI analysis (dark gray) results. Insets describe current time courses for original problem (left) and estimated time courses (right, bright gray: MEG-alone analysis, dark gray: combined analysis).