
Fig. 7.
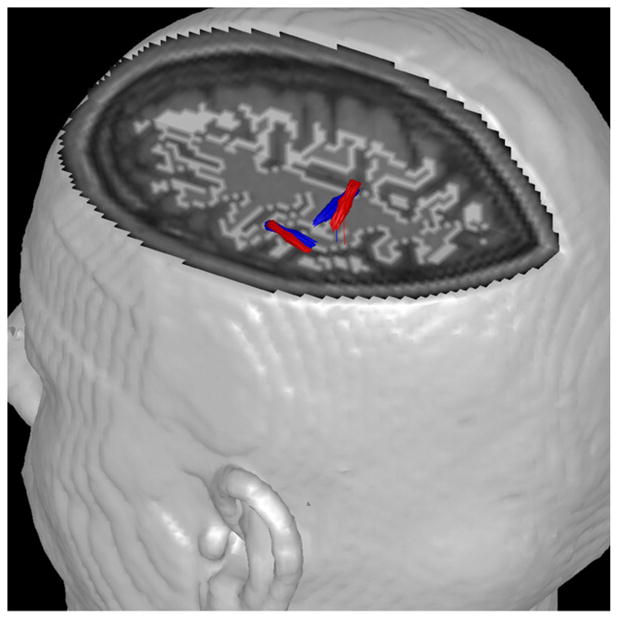
Empirical data (21 ms window). Analysis results for the combined analysis with fMRI weighting using α=20, η=1.0 (red: fixed dipole source model; blue: rotating dipole source model). The orientations for the rotating model are from the peak amplitude time slice. Many arrows are seen closely overlapped.