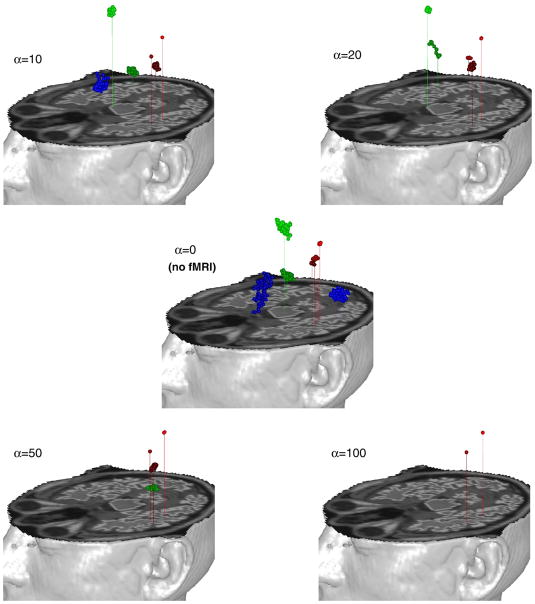
Fig. 8.
Empirical data (21 ms window). Analysis results using diagonal noise covariance estimation for MEG analysis (α=0, no fMRI effect) and the combined analysis with various fMRI weightings (α=10, 20, 50, 100, keeping η=1.0). Red (dark and light) blobs in each figure seem to be associated with right hand median nerve stimulations. Those locations are consistent with the results of Fig. 6. Green (dark and light) and blue (dark and light) blobs are likely to be spurious sources arising from mismatch between empirical noise and noise model.

