
Figure 6.
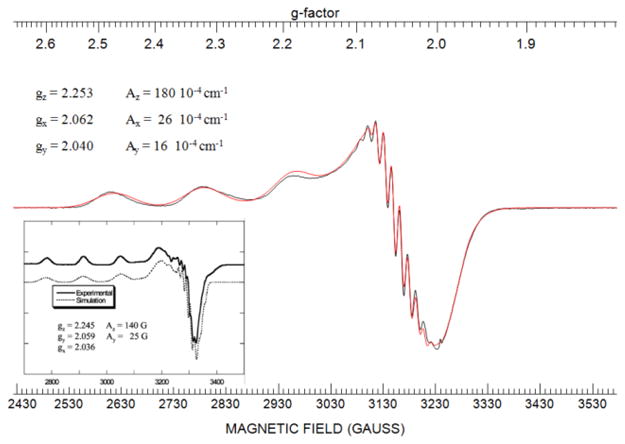
X-band EPR spectrum (in black) and its simulated spectrum (in red) of Met121Hcy azurin. X-band experimental conditions: microwave frequency, 9.05095 GHz; power, 0.2 mW; modulation amplitude 5 G, time constant, 32 ms; sweep time, 60 s; number of scans, 30; gain, 1000; temperature, 29 K. Inset: X-band EPR spectrum of nitrosocyanin from ref 30.