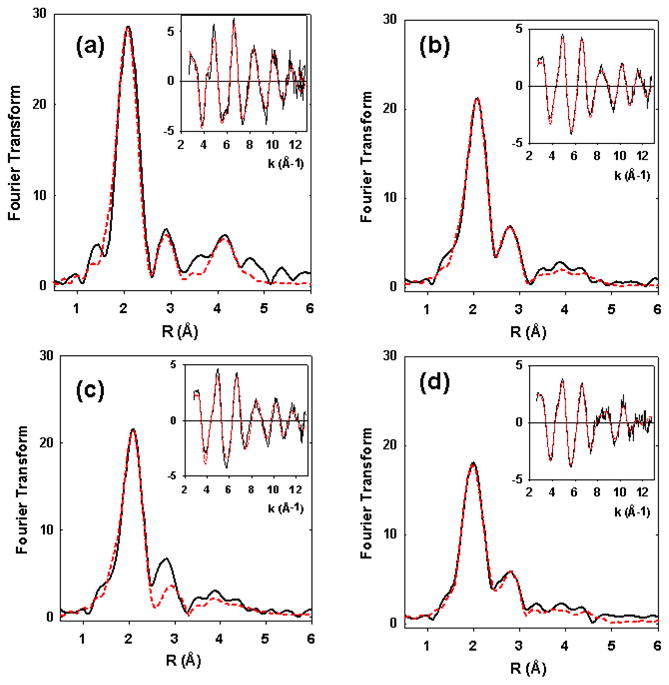
Figure 7.

Fourier transform and EXAFS (inset) for the WT azurin and Met121Cys and Met121Hcy variants. Experimental data are shown as solid black lines and the simulation is shown by dashed red lines. Parameters used to fit the data are listed in Table 2. (a) WT azurin at pH 5.0; (b) Best fit of Met121Cys variant at pH 7 (bolded in Table 2) with one short (2.17 Å) and one long (2.74 Å) Cu-S interaction; (c) The best fit of Met121Cys variant at pH 7, obtainable using only the short Cu-S distance; (d) Met121Hcy variant at pH 7.
