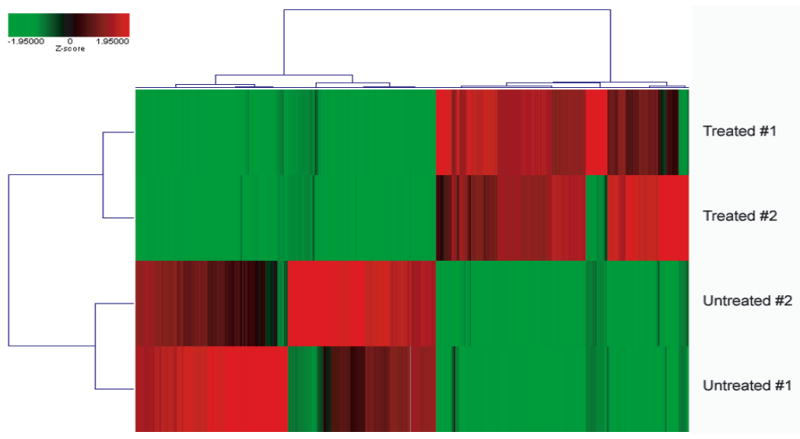
Figure 1. Hierarchical clustering of the differentially expressed transcripts in all of the biological replicate samples.

Two-way hierarchical clustering using Ward’s Minimum Variance as the heuristic criteria and Euclidean distance as the similarity metric was performed on all 4 samples using the z-score transformed expression values for the 2,339 transcripts that were identified as differentially expressed (fold-change > 5, log ratio p-value < 0.001) when the two groups were compared to each other (984 genes displayed increased expression, 1,355 displayed decreased expression in response to 5-azadC/TSA). The degree of relatedness between each sample is represented by the dendrogram (hierarchical tree) presented in this figure, wherein the height of each branch represents the distance between the 2 objects being connected. The relationship between the color intensity and the expression level is illustrated by the color bar.
