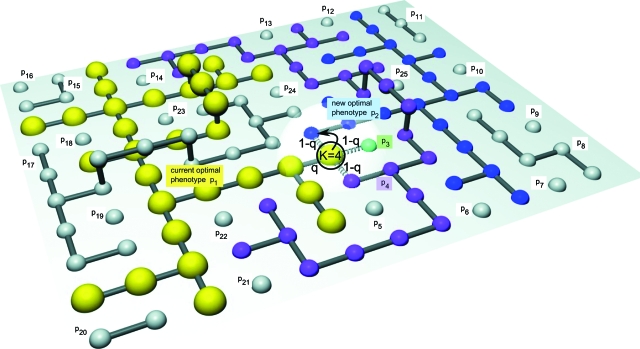
Figure 1. Sequence space of RNA genotypes and the neutral networks they form.
Genotypes (spheres) encoding the same phenotype (p1 to p25) are connected via neutral mutations (with probability q). Non-neutral mutations (with probability 1−q) are only explicitly shown (dashed connections) for one highlighted genotype (black circle). The number of phenotypes available to this genotype is K=4, these are drawn in color (p1 to p4). The yellow neutral network (p1) is under selection and has high fitness (large spheres), all other genotypes are lethal. After an environmental shift the blue phenotype (p2) might become beneficial so that the highlighted genotype could make a transition with only one mutation (black arrow).

