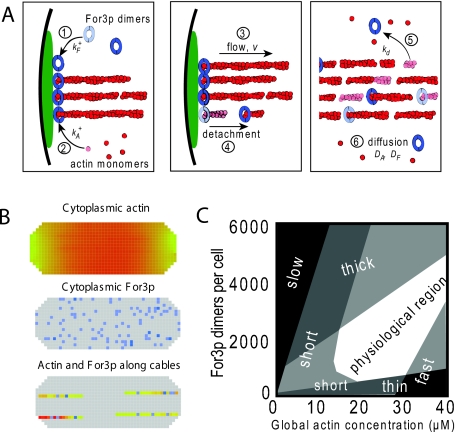
Figure 3. Model of actin cables in fission yeast (Wang and Vavylonis, 2008).
(A) Schematic showing the basic processes of the model. (B) 3D computational lattice model (http://athena.physics.lehigh.edu/research/actin_cable_applet.html) accounting for the small number of For3p which are treated as discrete units. (C) Qualitative dynamical phase diagram describing the morphology of the actin cable system as a function of actin and For3p concentration.

