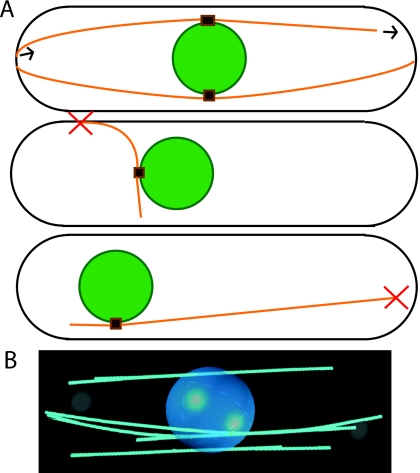
Figure 4. Illustration and results of the model of Foethke et al. (2009).
(A) Model schematic: microtubules orange, nucleus green, microtubule organizing centers (MTOCs) brown. Red X indicates likely catastrophe. The model includes four MTOCs each nucleating four microtubules. Top: normal alignment, polymerization, depolymerization. Middle: likely catastrophe due to force, preventing medially aligned microtubules. Bottom: likely catastrophe due to length, necessary to center nucleus. (B) Representative image at steady-state, using online content with default parameters (http://www.nature.com/msb).

