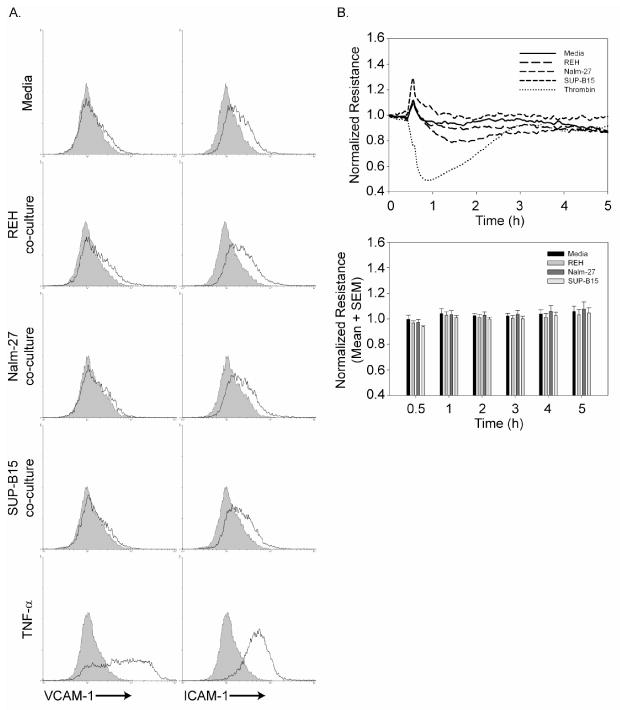
Figure 1. ALL does not elicit an inflammatory response by HBMEnd.

A. HBMEnd were grown to confluence in 6-well plates and exposed to ALL co-culture (1×10⁶ leukemia cells/mL), media (negative control) or TNF-α (100ng/mL) for 4h. Following treatment, leukemia cells were rinsed away and samples were collected, immunostained with antibodies to detect VCAM-1 or ICAM-1 (solid line) or matched isotype control (shaded histogram), and analyzed by flow cytometry. B. (Top panel) HBMEnd were grown to confluence on ECIS electrodes (8-well, 10 electrode). After collecting baseline resistance data for 30 min, leukemia cells (1×10⁶ cells/mL), media negative control, or thrombin positive control (4U/mL) were added to each ECIS well. Resistance data were collected for a total of 5h and are normalized to the initial resistance reading for each condition. (Bottom panel) Normalized resistance readings for each treatment are shown at discrete time points following addition of each condition. Data are expressed as mean normalized resistance+SEM, N=3.
