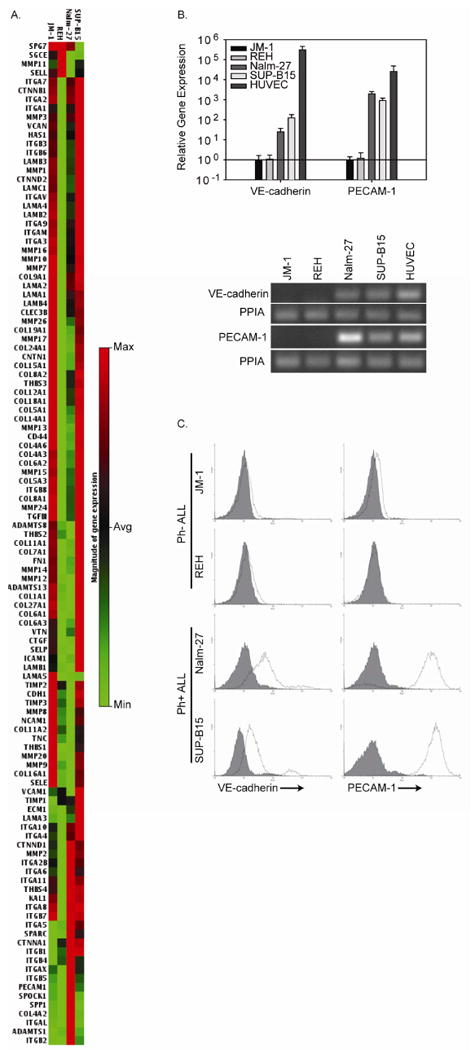
Figure 2. Ph+ ALL cell lines co-express cell-surface VE-cadherin and PECAM-1.

A. RNA isolated from the Ph-ALL cell lines, JM-1 and REH, and the Ph+ ALL cell lines, Nalm-27 and SUP-B15, was evaluated by a pathway specific cDNA microarray focused on expression of human extracellular matrix proteins and adhesion molecules. For each gene evaluated, the gene expression map compares gene expression across the cell lines evaluated and shows low level gene expression in light green and high level gene expression in red. B. (Top) RNA isolated from ALL cell lines was subject to real-time RT-PCR to confirm VE-cadherin and PECAM-1 expression. The expression level of VE-cadherin and PECAM-1 for each cell line is compared to the expression levels of JM-1 cells. (Bottom) Gel electrophoresis of the PCR products demonstrates that VE-cadherin and PECAM-1 is expressed by Nalm-27 and SUP-B15 cells with PPIA used as a loading control and HUVEC RNA used as a positive control. C. JM-1, REH, Nalm-27, and SUP-B15 cells were evaluated for cell surface VE-cadherin and PECAM-1 expression by immunostaining and flow cytometric analysis (solid line represents specific primary antibody while shaded histograms represents the isotype matched control).
