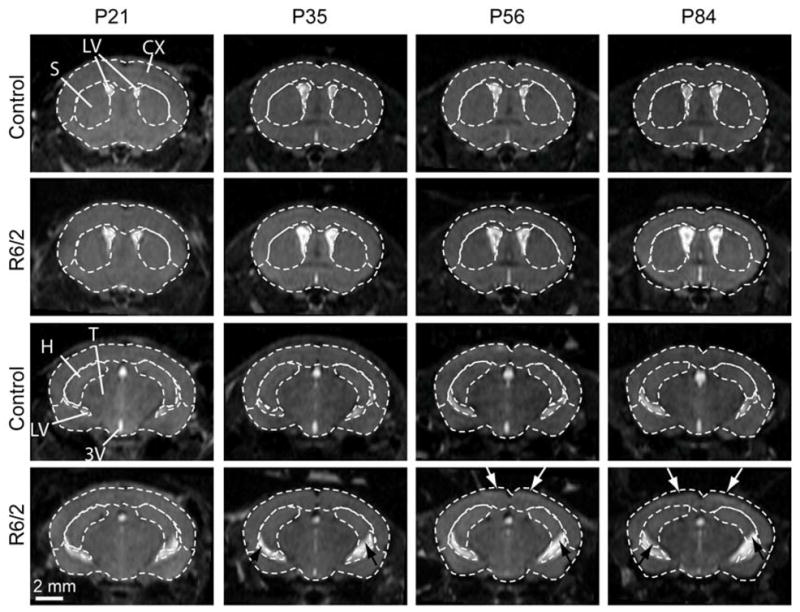
Figure 2.

Representative longitudinal in vivo MRI images of a control and an R6/2 mouse at two coronal levels. Boundaries of major brain structures were defined in the control mouse brain images and displayed as dotted lines in both control and R6/2 mouse brain images. Potential atrophy in the cortex and hippocampus are indicated by white and black arrows, respectively. Structural abbreviations are: 3V, third ventricle; CX, neocortex; H, hippocampus; LV, lateral ventricles; S, striatum; and T, thalamus.
