
Figure 6.
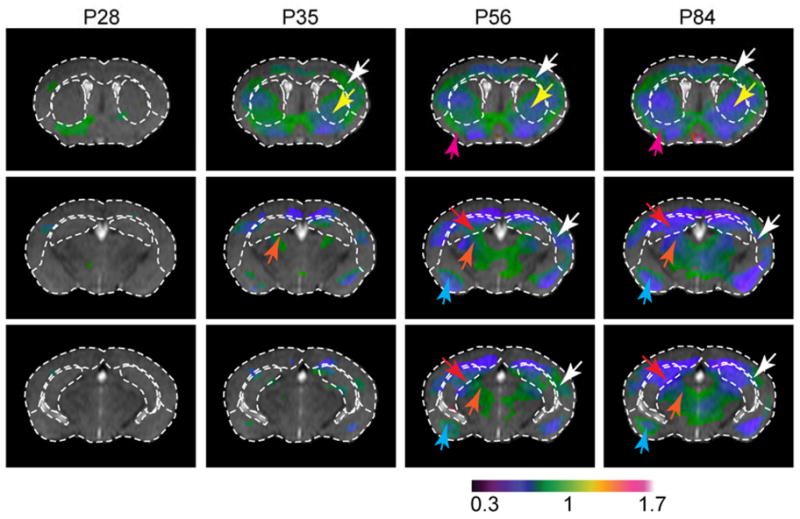
Representative in vivo MRI images with deformation-based morphometry (DBM) of relative tissue volume; major structural boundaries defined in the control mouse are overlaid on the R6/2 mouse and color-coded Jacobian maps for visual guidance. In the Jacobian map, only regions with significant change in local tissue volume (false discovery rate = 0.05) are shown. The color reflects the normalized local tissue volume with respect to local tissue volume in similar regions in the control mouse brains. Green and blue in the Jacobian map indicate mild and severe atrophy, respectively. Atrophy in the neocortex (white arrows), striatum (yellow arrows), piriform cortex (magenta arrows), hippocampus (red arrows), thalamus (orange arrows), and amygdala (cyan arrows) can be appreciated.