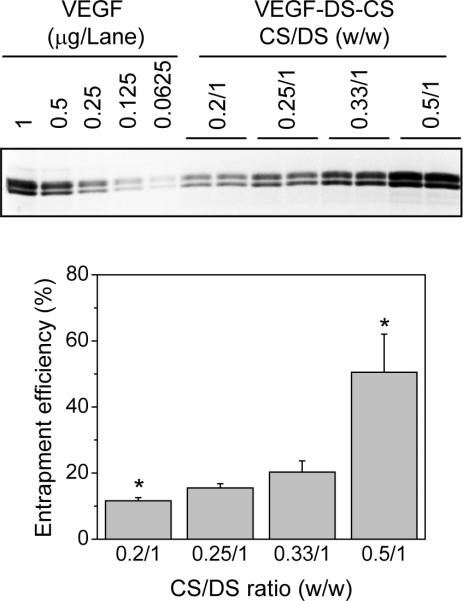
Figure 4. VEGF entrapment efficiencies at various CS:DS ratios.
VEGF PECs were prepared in reaction mixtures containing 0.04 mg VEGF, 1 mg DS, and 0.2, 0.25, 0.33, or 0.5 mg CS. The amounts of VEGF in the PECs were determined by SDS PAGE and densitometry analysis. The upper panel shows a representative SDS gel loaded with VEGF standards at the indicated quantities (left 5 lanes) and aliquots of VEGF PEC suspensions prepared at the indicated CS:DS ratios (right 8 lanes). The lower panel shows VEGF entrapment efficiencies in these PEC preparations. Entrapment efficiency was calculated by comparing the amount of incorporated VEGF with that added to the reaction mixture. Data are presented as mean ± SD, n = 4–7, * p < 0.05 compared to the rest of the groups.

